This series of graphs from Randall Munroe's xkcd is entirely self-descriptive. As the mouseover text on the original image says: "The contents of any one panel are dependent on the contents of every panel including itself. The graph of panel dependencies is complete and bidirectional, and each node has a loop." That is, if you decide that you want to change the size of the black pie slice in the first panel, you then have to change the height of the first bar in the second panel (which changes the height of the second bar), and then change sub-panels 1, 2, and 3 in the third panel (indefinitely changing the sub-sub-sub-etc. third panel). What I love about this is how it's such a complex intra-active system without relating any useful information to the viewer. The workings of this map (or comic, or graph, or drawing) are entirely internal.
What makes this funny to me is how Munroe uses the traditional language of visual information (i.e. maps , charts, graphs) to present something inward-looking, and really, pretty useless. It's not a wolf in sheep's clothing -- it's existentialism in sheep's clothing (interesting to think about, very abstract, and not at all directly relevant to your life). But he's not trying to trick the viewer into thinking that it's anything more than that. A cursory glance may make you think there's something more going on here, but read the text and you'll see that all the things this map refers to are located within the map itself.
The great-great-great-ancestor of this map could be Magritte's "The Treachery of Images."
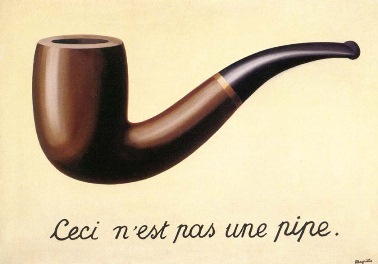 It's not a pipe, but it looks like one. The original image is a painting of a pipe, which you can't smoke with. Similarly, Randall Munroe's map is not a map -- it's a map of a map. Or does that make it a map? You can make a map of a thing, but you can't make a pipe of a thing (apples notwithstanding). Maps, drawings, paintings, charts, and graphs are all forms of visual representation, and yet visual objects themselves, which makes it tricky to deal with when an object visually represents itself.
I forgot what I was talking about!
Posted by Scott