Here is the map I kept promising to show Neal in class last week but then kept forgetting. It is what inspired my project idea of movie settings v. filming locations. The map shows all the locations in CA that stand in for different locations during movie filming.
But then today I was walking through the Mall of America to find some pants and I saw this ad for a fancy shaving shop called "The Art of Shaving." If I had needed a shave, I probably would have gone in, but I didn't. Anyway, the map inspired a very new direction that I think I like much better than the old. So we'll see how it goes.
Posted by Lisa.
October 31, 2010
October 28, 2010
I'm a believer
The Believer is my favoritest magazine. The covers are designed by David Eggers (author of A Heartbreaking Work of Staggering Genius) using illustrations by Charles Burns! There are no ads; just original content about literature, the arts, and ideas. Everything is set in Clarendon and printed on hearty paper rather than a glossy, thin paperlike product. It's lovely to hold, view, and peruse.
meister josh
Avant Garde spread
October 27, 2010
Map of Cannibalism - a traditional example
Here's a traditional example of a geographic map, which represents the global spread of cannibalism. I'm posting it as it may end up relating to my topic.
To quote from the Strange Maps blog 299 - Niam Niam: the Cannibal Map of the World:
This map, from the German/Austrian publisher A. Hartleben, dating from the early 20th century by the look of it, presents a map of the range of anthropophagy, both contemporary (in red) and historical (in yellow).
A more up-to-date map would have to include Armin Meiwes, the German internet cannibal.
Posted by Sylvia
100 years of music using London Underground map
The challenge: chart the branches and connections of 100 years of music using the London Underground map.
The result:
The full map (PDF) is linked in Going Underground blog from the Guardian's Culture Vulture.
Posted by Sylvia
The Family Tree
Which came first, the idea of displaying genealogy as linking familial relations from top to bottom chronologically, or the term 'family tree'?
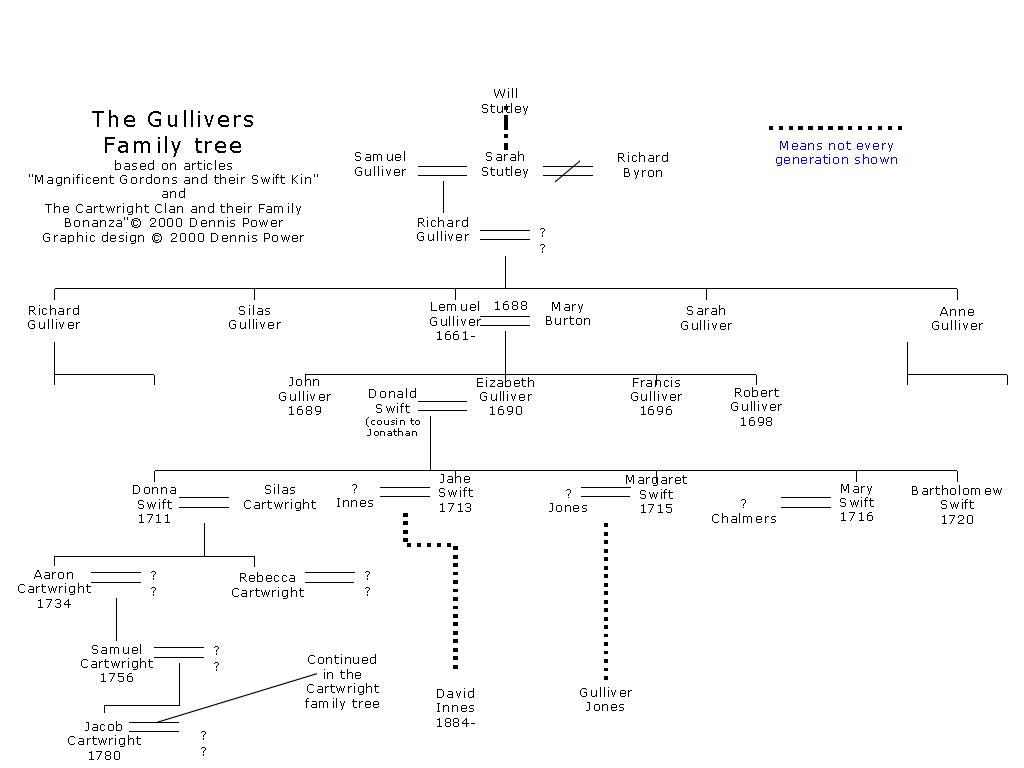
Here's a pretty typical family tree, comprising what looks to be around 9 generations. The farthest back in history is at the top-most part of the 'tree,' and the most recent at the bottom. Weirdly, this is completely inverse from how trees actually grow (you know, from the ground up), but the analogy has stuck so well that it's very easy to find 'family trees' that are stylized to resemble physical trees.
This one's a pretty lazy example, with the 'family tree' being superimposed onto an illustration of a tree. Poor Scotty must have been kicked out of the family or something.
This one's great for a number of reasons. The entities represented are actually connected via branches that wind around each other to signify familial relations, and the creator realized the backward nature of the 'family tree,' choosing to instead build it from the ground up. You can see Donald Duck in the second row from the top (second-to-youngest generation), third from the left. There's a nice depiction of different families that Donald's lineage stems from by means of separate trees, the branches of which get jumbled together. In addition, the fact that we skip a few generations going from Pintail Duck (bottom, middle tree) to Humperdinck Duck is shown by the branch momentarily disappearing behind leaves: that chapter of history is obscured to us.
Family trees are a way of tracking relations between members of one or many families, but once you go enough generations back, or enough cousins sideways, it becomes increasingly difficult to accurately, visually portray the information. For instance, it's likely (though I'm sure you don't want to hear it), that your biological parents (or you and your partner), have a common ancestor within written history. Super-likely if you and your partner have the same ethnic and cultural background. For the family tree, this means that a 'branch' would split (via children, grandchildren, etc.) and eventually rejoin. Visually, this would mean 'branches' crossing over each other.
Is it possible to create an organized family tree that includes dozens of generations and thousands of people, given the super-prevalence of incest?
Is a tree the best visual metaphor we can come up with?
How would a family tree of families be depicted visually? That is, instead of representing individuals, representing families (and how do you begin to define that?)
Posted by Scott.
Magazine Spreads & Etc.
First, a few interesting magazine-layout-related articles I've found:
The Creative Design Blog has a short article about an early 2010 Ikea ad that-while keeping text to a minimum-does some interesting things with an underlying grid-like structure across the spread:
The IDSGN Blog details a lecture given by Jason Santa Maria (a video is available at the bottom of the page) about applying magazine spread design sensibilities to the web:
If you're looking for some good inspiration for your spreads, check out this page on Best Design Options.
Lastly (and kinda unrelated), The Economist has an article about how the letterpress and its mechanical aesthetics have been (partly) misapplied in the digital age: Letterpress Revived.
Posted by Jordan
October 26, 2010
Scott McCloud, Linux, and e. coli
Scott's Chris Ware post from last week got me thinking about comics as maps. I was reminded of the work of Scott McCloud, a graphic novelist in his own right, but better known for his critical, academic writings about the medium of comics. The "map" (I suppose technically it is more of a chart, but that's a kind of map, right?) at left moves from abstraction to representation along the vertical axis and from drawings to words along the horizontal. Taken together, it is a pretty awesome representation of the vocabulary, grammar, and meaning available not just to comics artists, but to any visual artist.
The second map compares the Linux OS with e. coli bacteria. I don't fully understand this, but I think it is fascinating.
Both of these maps came from http://blog.visualmotive.com/
Posted by Dave
October 25, 2010
Map: Marian Bantjes' Influences
Marian Bantjes- an elite artist, designer, typographer, illustrator and writer- has mapped out her obsessions, travels, personal artistic influences, themes, working materials, styles of work, etc. A visual representation, and work of art, that truly represents who she is as an individual. (Map dated from August 2006)
See it on her website: Influence Map
Posted by Anne Ulku
See it on her website: Influence Map
Posted by Anne Ulku
Labels:
bantjes,
conceptual cartography,
graphic design,
Maps
Minimal Text Spreads
When browsing magazine spreads, I find myself preferring the minimal designs. I like the effect of a two page spread with a minimal amount of text within a text dominated magazine.
Posted by Caryn
Labels:
magazine,
magazine spread,
minimalism,
typography
October 24, 2010
Perceived geogrpahy
Following up on the theme of maps charting perceived geography, Frank Jacob's "Strange Maps" blog on bigthink.com recently ran a series of European maps with countries labeled from different perspectives, mostly national. (Fair warning: many, if not all, of the "perspectives" on the maps fall well within the realm of stereotyping and name calling, which is not behavior I endorse.) I've copied just the "U.S. Perspective" map below, but the whole series is quite extensive, and most of the rest are from various European perspectives.
posted by Marin
October 21, 2010
Google Font Directory
More information on web-based fonts. Of course Google has a huge initiative in this area. This website explains Google's Font Directory and how the fonts can be used in CSS under an open source license. This is cool. And Typekit has partnered with Google on it too.
posted by Tim
p.s. I know it's ironic that I took a screen cap of an editable typeface to post it as an image on this blog...
October 20, 2010
Very Small Array
Very Small Array is a blog by Dorothy Gambrell, the creator of the webcomic Cat and Girl. Most of it is dedicated to various interesting maps she creates, many relating to New York City.
Recently she did a series of maps based on local dining establishments. She followed up on a few of them with a chart mapping percentage of Starbucks and Chinese restaurants as a percentage of all restaurants of a given area, along with each area's median household income, which was an interested way of looking at things
I was also particularily fond of this map of the college stickers on cars in a neighborhood in Brooklyn.
Posted by Erich.
Applying Type to Product
In parallel with my current Intro to Graphic Design course, I've been spending a lot of time lately thinking about real-world applications of type within commercial layouts and presentations.
A great resource is the blog The Dieline, which has MANY examples of international packaging design. It's interesting to see how the innate "qualities" of a piece of packaging are deeply tied to the chosen type; how the type "loads" the object with meaning before you've truly read the text:
Also, designer Tyler Thompson developed the site Boarding Pass/Fail earlier this year based on redesigning the airline boarding pass to be more elegant and easy-to-digest. There are several examples that exhibit significant differences in their use of type and grid:
My redesign attempt is: here.
Posted by Jordan
October 19, 2010
Chris Ware's Maps
The climax of Chris Ware's 2000 graphic novel Jimmy Corrigan: The Smartest Kid on Earth traces the genealogy of Jimmy's adopted sister Amy to the late 1800s, revealing that Jimmy and Amy are actually related. Using symbols and images rather than text, Ware creates a map for the reader to follow, with one scene leading to another chronologically but branching out thematically, calling out motifs in the novel and representing characters with just enough marks for them to be recognizable and unique. The map in Jimmy Corrigan is one of specific people and relationships, representing on a larger scale the changing social landscape of 20th century mid-America.
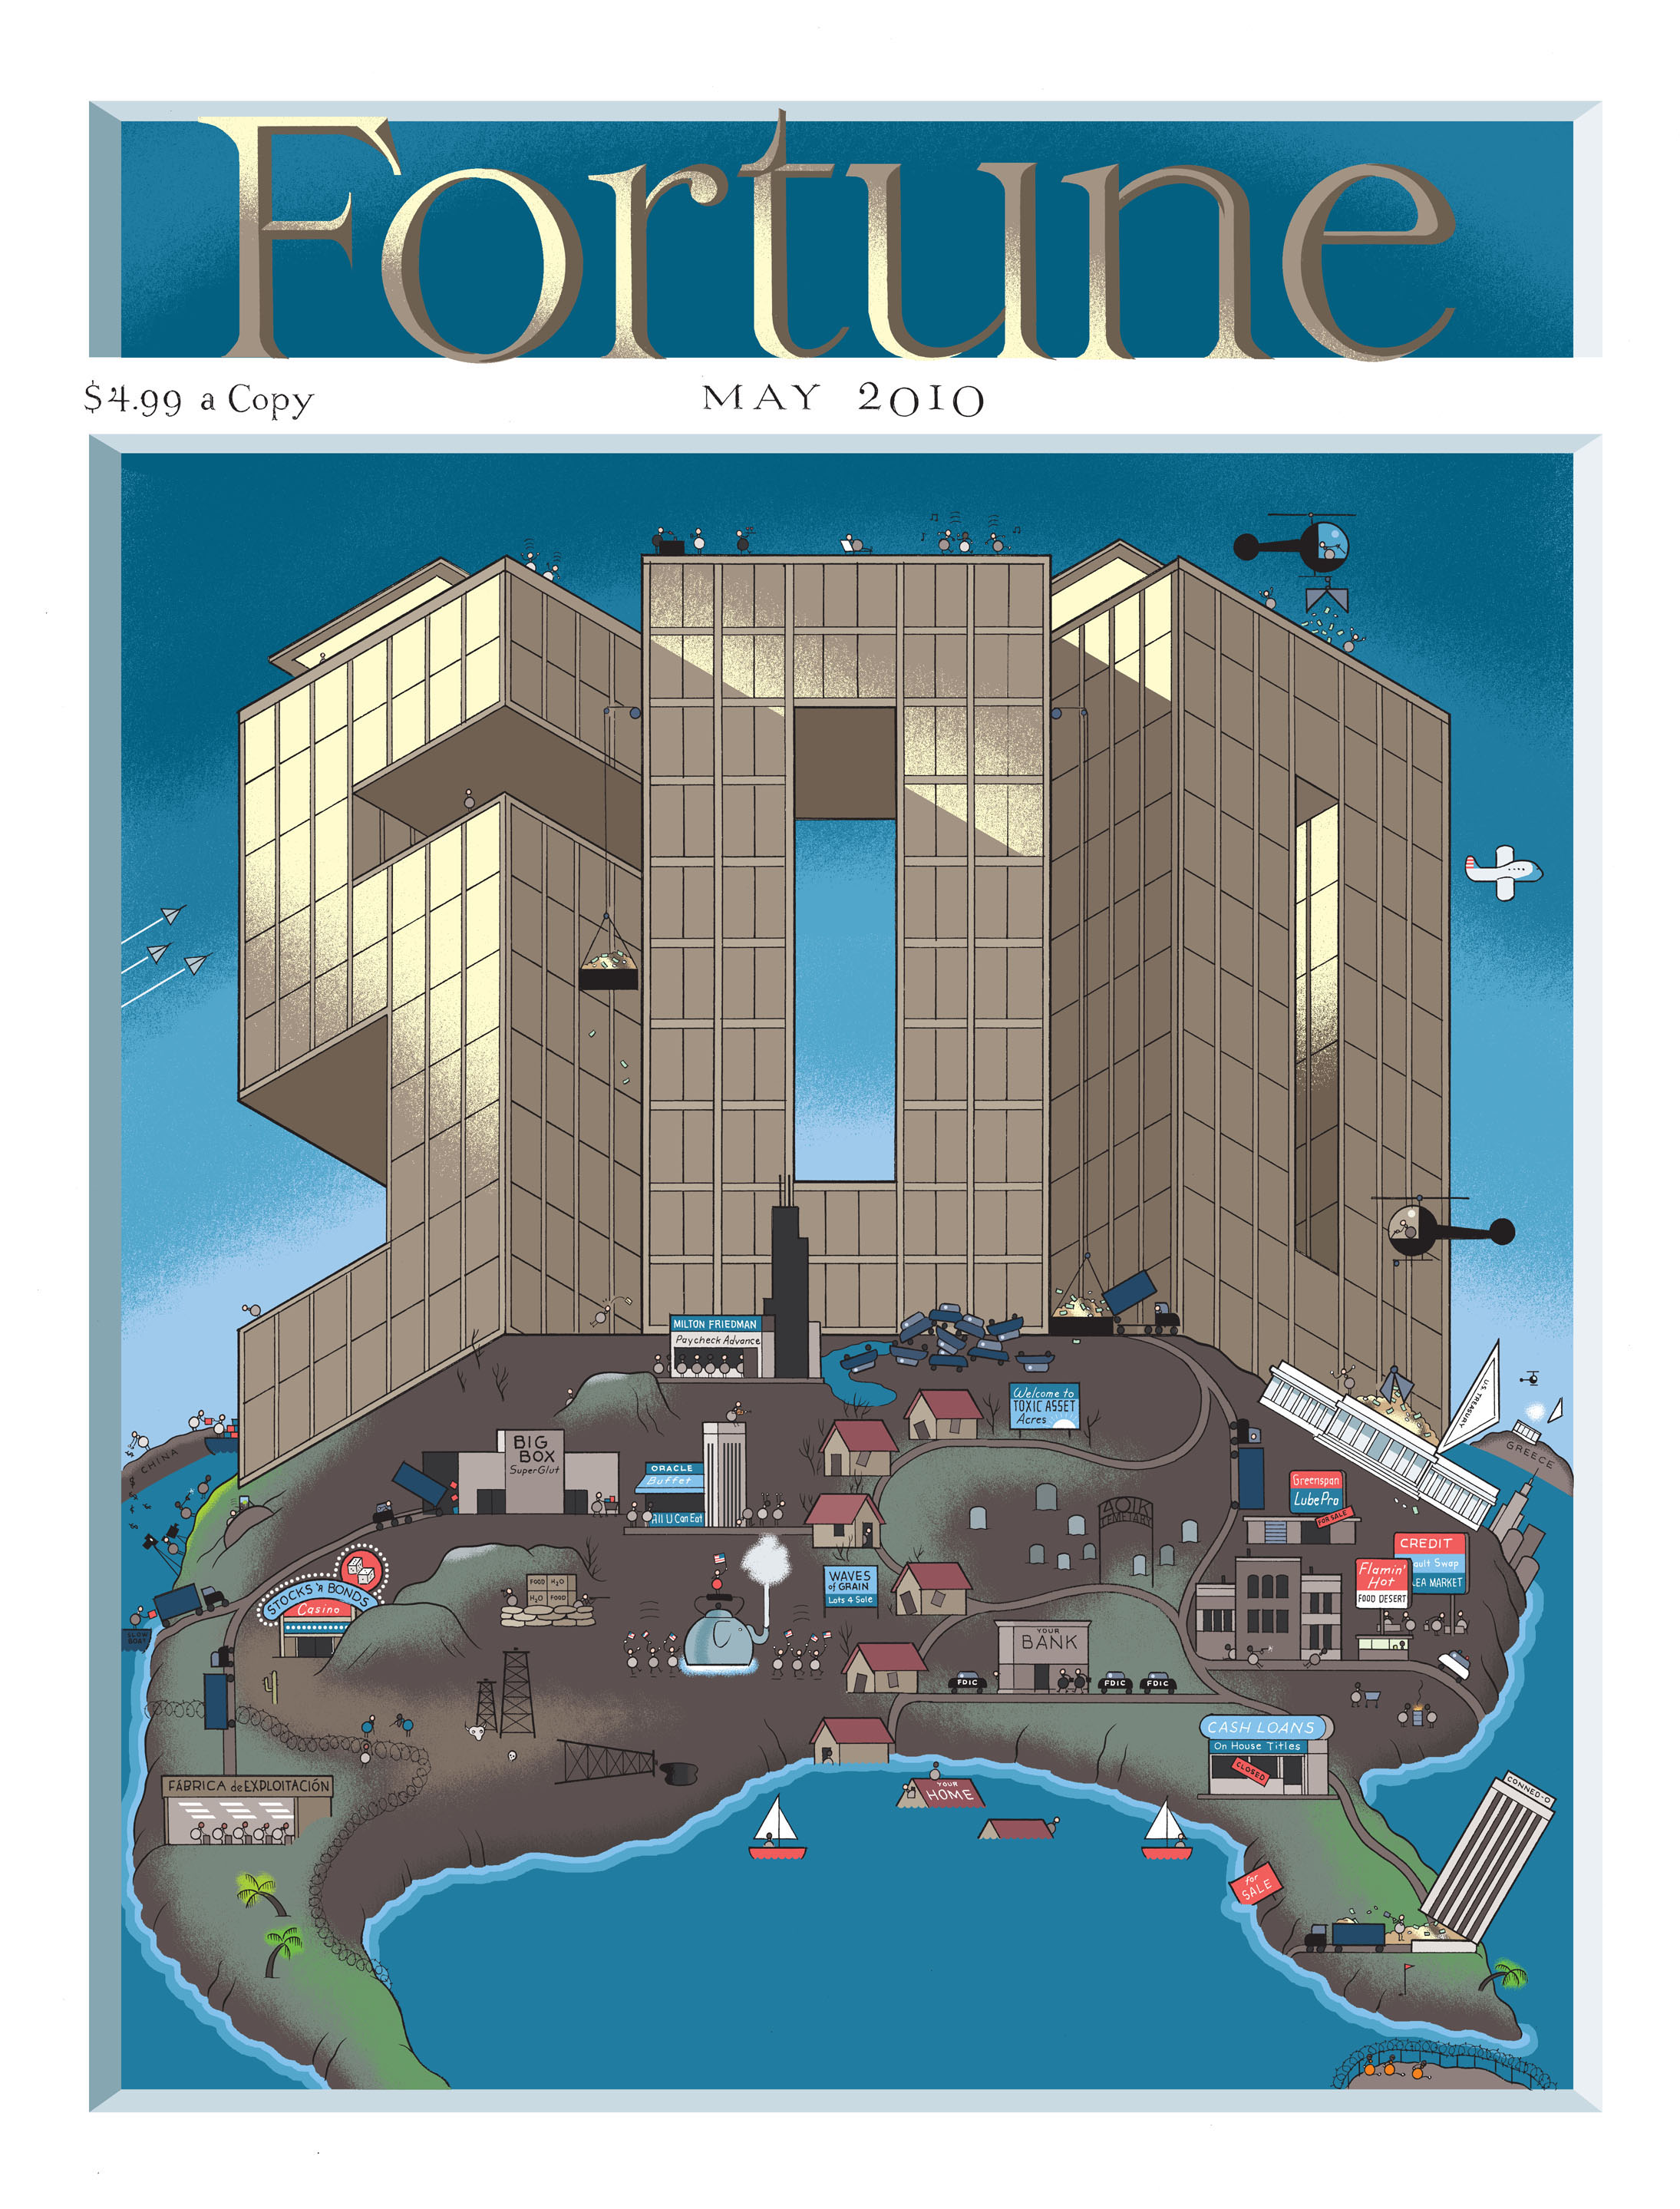
As a comic artist, Chris Ware's entire body of work could be consider maps: they represent (people, places, ideas). Some are more literal than others, like his (rejected) Fortune magazine cover:
Visually and with text ("Toxic Asset Acres," "Fábrica de Exploitación"), Ware's map of America attacks the magazine and its values at the height of the Recession. Another map (from Building Stories) charts the changing occupants of an unchanging apartment building:
This map's architectural objectivity and accuracy is juxtaposed against the ideas of nostalgia and subjective experiences the places we live. Almost all of Ware's work captures this melancholy, but the craft of his art strives for geometric purity and almost mechanical (but always hand-drawn) linework. I'm interested in maps that can accurately depict emotion and personality as well as space, geography, and architecture.
Posted by Scott.
Labels:
Architecture,
Building Stories,
Chris Ware,
Comics,
Jimmy Corrigan,
Maps
world map by population
What I like about this map is that it takes otherwise familiar, unsurprising data and presents it in a novel way.
I'm intrigued by the possibilities of stretching this model -- which in my mind amounts to forcing two conceptually irreconcilable or at least disparate data measures into the same representation -- to see how far it can go and still make sense.
Posted by Dave
Map: Biggest Drawing in the World
This is a map that has created the largest self-portrait in the world.
A GPS system, traveling around the world through delivery trucks and other modes of transportation, became the trackable strokes of the medium, or the "pen". A very long list of specific coordinate travel destinations given to the delivery vehicles, marked the points of the image on the map. The GPS was able to track the entire journey - lasting 55 days, going through 6 continents and 62 countries with a total length of 110,664 km.
Posted by Anne Ulku
October 18, 2010
Maps of Music History by Dave Muller
I first saw an example of Dave Muller's Rock-n-Roll timeline in an Edward Tufte book on visualization. I was fortunate to see it full-scale at the ICA in Boston a few years ago. I like how he showed the connections between music movements and how one style of music developed from an earlier style of music.
I couldn't find an image of his Rock-n-Roll timeline, but the image here is of another map that he created, which is called As Below, So Above.
Here's the blurb from the ICA webpage:
The work will incorporate a diagrammatic timeline of chart-topping rock hits—found in Reebee Garofalo and Steve Chapple’s book Rock ‘n’ Roll Is Here to Pay(1977)—from the 1950s to 70s, including Elvis Presley, the Beatles, and the Supremes. Reproduced at epic scale, it will be hand-illustrated with rocks, grass, and plants, as if a landscape cut in cross-section. Consecutive years will extend before and after these decades into a timeline horizon. In the "sky" space above, framed paintings resembling stars will radiate the names of music categories—rock's latest offshoots within the Boston music scene. Below the horizon will be illustrations of albums by "underground" artists of cult, if not commercial, fame.
Here's the link to the ICA page on As Below, As Above: http://www.icaboston.org/exhibitions/exhibit/muller/
Posted by Sylvia
October 17, 2010
Maps and Mattresses
Guillermo Kuitca had an exhibit at the Walker this summer, which is where I first saw the piece above. It's a little hard to see from the photo, but those are all small mattresses painted with what look to be pretty standard road maps, and upholstery buttons marking the major cities. The next photo is of a different piece, but it has the same general idea and I think you can see the map part a bit better.
The thing you can't tell from either photo is that Kuitca often uses real place names but imaginary geographies. One piece that was at the Walker exhibit used place names from Minnesota and the upper Midwest, so when I first looked at it, it seemed familiar until I looked closer and realized that places were all in the "wrong" place.
And finally, another map that I like because it is based on perceived geography rather than physical reality:
Posted by Marin
October 14, 2010
Maps, maps, and more maps
The examples of Salavon's work we saw in class yesterday reminded me of Byron Kim's Synecdoche. To make this piece he went out on the street and asked people if he could take a sample of their skin color. Each square of this panel is a different person's skin color (taken from their arm, since, as he explains, people's face color changes too much when they speak) MOMA has a short audio clip of him talking about the piece that you can hear here.
Below are three works created by Maya Lin for an exhibition called Systematic Landscapes. She's an artist/architect taking traditional map content (geography) and depicting it in some neat artistic ways. She also designed the Vietnam Memorial in DC (a map of that war? a map of the lives lost?). You can check out her site here.
This last piece is probably my favorite. She took an old atlas, 2D space representing 3d space, and cut into it in order to restore it to 3d space.
Finally, I found the below image stored on my computer in my random inspiration folder. I have no idea what it is from or where it is from but maybe it came from science textbook (?). Either way I think its awesome and map-y.
Posted by Lisa.
GOOD and This American Life
The magazine GOOD has some great maps and infographics. They convey a lot of information very elegantly.
You can see more examples here.
And for a non-visual example, here's an outstanding episode of This American Life about mapping. It includes an interview with Dennis Wood, the man who made the jack-o-lantern map we saw in class.
Posted by Molly
I was looking for a discussion of the issue of appropriation in typography and came across this article. Copyright, intellectual property, and the modern notion of ownership are up against the potential for instantaneous, universal dissemination of information made possible by the internets. There is a larger discussion of the notion of "open source" and how it relates to typography (and design in general) on the site where I found this article.
Confucius say, "He who owns grasps nothing."
comrade josh
October 13, 2010
Typographical Miscellany
Typophile has an interactive program made by Jonathan Hoefler detailing various typeface styles: Type 101.
I Love Typography has posted a lengthy - but really interesting - article on the anthropological and historical basis for letterforms: The Origins of ABC.
Lastly, there's a sizable discussion occurring online regarding The Gap's recent redesign: a functional, identifiable logo turned into another Helvetica-centered identity. Thoughts?
Posted by Jordan